---
layout: default
title: Saving Data
---
## [NanoLocz User Guide 1.3-1.4](https://george-r-heath.github.io/NanoLocz/docs/)  Installation - - Getting Started - - Saving Data \
Level - -
Detect - -
FineAlign - -
Localize\
Area Analysis - - Keyboard Shortcuts\
Simulation AFM - - YouTube Video Tutorials
# Saving Data
This section explains how to save data in NanoLocz. Data can either be saved/processed in bulk and for later use or by exporting the current views in the plots for figures/presentations.\
[1. Save or Batch Process Data](#1-save-or-batch-process-data)\
[2. Export Images, Videos and Data](#2-exporting-images-videos-and-data)\
[3. h5 and mat File Structure for NanoLocz](#3-h5-and-mat-file-structure-for-nanolocz)
## 1. Save or Batch Process Data
The following describes saving and batch processing options so that raw and processed data can be quickly reopened in NanoLocz or other software. See section 2 for export of images / movies for publication quality figures or presentations.
### Single or Batch Save

- To save one or multiple files open the Save Options using save
Installation - - Getting Started - - Saving Data \
Level - -
Detect - -
FineAlign - -
Localize\
Area Analysis - - Keyboard Shortcuts\
Simulation AFM - - YouTube Video Tutorials
# Saving Data
This section explains how to save data in NanoLocz. Data can either be saved/processed in bulk and for later use or by exporting the current views in the plots for figures/presentations.\
[1. Save or Batch Process Data](#1-save-or-batch-process-data)\
[2. Export Images, Videos and Data](#2-exporting-images-videos-and-data)\
[3. h5 and mat File Structure for NanoLocz](#3-h5-and-mat-file-structure-for-nanolocz)
## 1. Save or Batch Process Data
The following describes saving and batch processing options so that raw and processed data can be quickly reopened in NanoLocz or other software. See section 2 for export of images / movies for publication quality figures or presentations.
### Single or Batch Save

- To save one or multiple files open the Save Options using save  - Select the format, to retain all image and analysis data use combined file format options. To access the images and data analysis in other software use separate Image/video and Analysis tables formats.
- Select Files to save using the Save dropdown box:\
**Current File:** Selects the currently open image\
**All Files:** Selects all files in the open folder\
**All Processed:** Selects and displays only files that have been processed (levelled, filtered or analysed)\
**Session:** Saves all processed data in a single .mat file which can be reopened in NanoLocz
- Use the checkboxes next to each file name to select which files to Save.
- To level unprocessed data select the 'Level unprocessed data' option and images will be levelled using the current level settings in the main NanoLocz window.
- Select the Output folder you want NanoLocz to save to.
- Select subfolder preferences:\
**Create a new subfolder:** Generates 1 subfolder in the Output folder with the name: ‘xxxxxxx NanoLocz Output’ where xxxxxx is the name of the current open folder. Recommended for general use.\
**Create multiple subfolder(s):** Generates 1 subfolder per image/movie in the Output folder with the name: ‘Image Name’. Recommended if saving many separate tables and images.
- Press Save to run the save
## Filename Generation Options
Controlled by Output Filename:
* **Auto save (same name):** Saves using the same name as the filename (will overwrite files)
* **Prompt for name:** Asks to choose filename/location
* **Add suffix _copy:** Adds _copy to the filename
* **Add suffix _channel:** Adds _’channel’ to the filename where channel is replaced by the source channel eg '_Height-retrace'
* **Save to new location:** Asks the user to choose a folder
**Note**
* File extensions are stripped if they match known types (csv, png, mat, etc.).
* Auto save and add suffix will save to the output folder and overwrite files with matching filenames
### Format Options

### AutoSave
By turning on AutoSave - files will automatically be saved to the output folder according to the settings in Preferences. To change these setting - open the preferences window using the Cog icon or Settings option.

## 2. Exporting Images, Videos and Data
This section describes how to export data based on the current view - useful for publication quality figures, presentations, or exporting raw data in manual way. See section 1 for batch export options.
### 2.1 Image and Video export
**Option 1:**
* Select ‘Plot 1’ (left image panel) or ‘Plot 2’ (right Image panel) from the dropdown box

* Select the desired format from the dropdown box (.tiff, .csv, .txt, .xls, gif, .avi, .png, .jpeg or .pdf)
* Press the Export button, then select file name and save location.
* Don’t close the image window that pops up until after the file has saved
Note: Exporting as .tiff, .csv, .txt, or .xls enables export without loss of image information whereas export as .gif, .avi, .png, .jpeg or .pdf gives movies/images at presentation or publication quality with automatic scale bars and timestamps.
**Option 2** (good for creating publication quality figures or grabbing images quickly):
* Press the Pop Out button
- Select the format, to retain all image and analysis data use combined file format options. To access the images and data analysis in other software use separate Image/video and Analysis tables formats.
- Select Files to save using the Save dropdown box:\
**Current File:** Selects the currently open image\
**All Files:** Selects all files in the open folder\
**All Processed:** Selects and displays only files that have been processed (levelled, filtered or analysed)\
**Session:** Saves all processed data in a single .mat file which can be reopened in NanoLocz
- Use the checkboxes next to each file name to select which files to Save.
- To level unprocessed data select the 'Level unprocessed data' option and images will be levelled using the current level settings in the main NanoLocz window.
- Select the Output folder you want NanoLocz to save to.
- Select subfolder preferences:\
**Create a new subfolder:** Generates 1 subfolder in the Output folder with the name: ‘xxxxxxx NanoLocz Output’ where xxxxxx is the name of the current open folder. Recommended for general use.\
**Create multiple subfolder(s):** Generates 1 subfolder per image/movie in the Output folder with the name: ‘Image Name’. Recommended if saving many separate tables and images.
- Press Save to run the save
## Filename Generation Options
Controlled by Output Filename:
* **Auto save (same name):** Saves using the same name as the filename (will overwrite files)
* **Prompt for name:** Asks to choose filename/location
* **Add suffix _copy:** Adds _copy to the filename
* **Add suffix _channel:** Adds _’channel’ to the filename where channel is replaced by the source channel eg '_Height-retrace'
* **Save to new location:** Asks the user to choose a folder
**Note**
* File extensions are stripped if they match known types (csv, png, mat, etc.).
* Auto save and add suffix will save to the output folder and overwrite files with matching filenames
### Format Options

### AutoSave
By turning on AutoSave - files will automatically be saved to the output folder according to the settings in Preferences. To change these setting - open the preferences window using the Cog icon or Settings option.

## 2. Exporting Images, Videos and Data
This section describes how to export data based on the current view - useful for publication quality figures, presentations, or exporting raw data in manual way. See section 1 for batch export options.
### 2.1 Image and Video export
**Option 1:**
* Select ‘Plot 1’ (left image panel) or ‘Plot 2’ (right Image panel) from the dropdown box

* Select the desired format from the dropdown box (.tiff, .csv, .txt, .xls, gif, .avi, .png, .jpeg or .pdf)
* Press the Export button, then select file name and save location.
* Don’t close the image window that pops up until after the file has saved
Note: Exporting as .tiff, .csv, .txt, or .xls enables export without loss of image information whereas export as .gif, .avi, .png, .jpeg or .pdf gives movies/images at presentation or publication quality with automatic scale bars and timestamps.
**Option 2** (good for creating publication quality figures or grabbing images quickly):
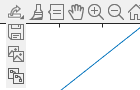
* Press the Pop Out button  * Resize the image
* Go to the top right hand side of the image and select the far left button from the toolbar
* For making figures choose ‘Copy as vector graphic’ Or for quickly copying an image choose ‘Copy as image’, the image can then be pasted into another program.
* Once pasted vector files can be ungrouped to enable movement and formatting of any labels (eg. scale bars, timestamps…)
* Only works for single images\
### 2.2 Analysis data export
* Open the data Viewer
* With Plot type table selected, choose the table of data required for export
* Select format (.txt, .csv, .xls) and press export
* Alternatively, manually select entries from the table and copy (ctrl+c)
### 2.3 MATLAB data export (MATLAB app only)
* From the ‘Plot 1’ dropdown select ‘data’
* From the desired format dropdown box select ‘MATLAB Workspace’
* Press the Export button
* Data will appear in the MATLAB workspace
## 3. h5 and mat File Structure for NanoLocz
When data is saved in the `.h5` or '.mat' format, NanoLocz organizes it into a hierarchical structure. This format allows for easy access to all data components used in analysis and visualization.
### Structure Overview
Each top-level field in the data struct (`Data`) becomes a **group** in the HDF5 file. Nested structures create **subgroups**, and each individual variable (numeric arrays, tables, strings) becomes a **dataset**.
### 📁 Typical HDF5 Layout
/Imagedata → Primary image data\
/ImageInfo → Metadata about the image (e.g., pixel size, channel info)\
/ref/ROIimage → Region of interest image used as a reference\
/ref/simImage → Simulated reference image (if available)\
/ref/LAFM → LAFM reference image (if used)\
/ref/av → Averaged reference\
/ImageLocs → Struct or array containing localized particle data\
/LAFMLocs → Struct with LAFM localization results\
### 📁 Typical MATLAB Data Layout
#### Image Data
- `Data.Imagedata`
→ The primary image data array.
- `Data.ImageInfo`
→ Metadata about the image, including:
- Pixel size
- Scan size
- Channel information
---
#### Particle Detection (`ImageLocs`)
- `Data.ImageLocs`
→ A struct containing detected particle data.
- `Data.ImageLocs.Locs`
→ A table where each row corresponds to a detected particle. Columns:
1. `x` — x-coordinate
2. `y` — y-coordinate
3. `z` — height
4. `ccr` — cross-correlation value
5. `Frame` — frame number
6. `id` — unique particle ID
7. `Track id` — tracking ID (for tracked particles)
8. `Angle` — orientation angle
---
#### LAFM Localizations (`LAFMLocs`)
- `Data.LAFMLocs`
→ A struct containing LAFM localization results.
- `Data.LAFMLocs.Locs`
→ A table where each row corresponds to a localization event. Columns:
1. `x` — x-coordinate
2. `y` — y-coordinate
3. `z` — height
4. `Peak Prominence` — peak prominence
5. `Particle` — particle ID
6. `Frame` — frame number
7. `Time` — time point
8. `ccr` — cross-correlation value
9. `PT Cloud RMSE` — point cloud root-mean-square error
10. `Error` — localization error estimate
* Resize the image
* Go to the top right hand side of the image and select the far left button from the toolbar
* For making figures choose ‘Copy as vector graphic’ Or for quickly copying an image choose ‘Copy as image’, the image can then be pasted into another program.
* Once pasted vector files can be ungrouped to enable movement and formatting of any labels (eg. scale bars, timestamps…)
* Only works for single images\

### 2.2 Analysis data export
* Open the data Viewer
* With Plot type table selected, choose the table of data required for export
* Select format (.txt, .csv, .xls) and press export
* Alternatively, manually select entries from the table and copy (ctrl+c)
### 2.3 MATLAB data export (MATLAB app only)
* From the ‘Plot 1’ dropdown select ‘data’
* From the desired format dropdown box select ‘MATLAB Workspace’
* Press the Export button
* Data will appear in the MATLAB workspace
## 3. h5 and mat File Structure for NanoLocz
When data is saved in the `.h5` or '.mat' format, NanoLocz organizes it into a hierarchical structure. This format allows for easy access to all data components used in analysis and visualization.
### Structure Overview
Each top-level field in the data struct (`Data`) becomes a **group** in the HDF5 file. Nested structures create **subgroups**, and each individual variable (numeric arrays, tables, strings) becomes a **dataset**.
### 📁 Typical HDF5 Layout
/Imagedata → Primary image data\
/ImageInfo → Metadata about the image (e.g., pixel size, channel info)\
/ref/ROIimage → Region of interest image used as a reference\
/ref/simImage → Simulated reference image (if available)\
/ref/LAFM → LAFM reference image (if used)\
/ref/av → Averaged reference\
/ImageLocs → Struct or array containing localized particle data\
/LAFMLocs → Struct with LAFM localization results\
### 📁 Typical MATLAB Data Layout
#### Image Data
- `Data.Imagedata`
→ The primary image data array.
- `Data.ImageInfo`
→ Metadata about the image, including:
- Pixel size
- Scan size
- Channel information
---
#### Particle Detection (`ImageLocs`)
- `Data.ImageLocs`
→ A struct containing detected particle data.
- `Data.ImageLocs.Locs`
→ A table where each row corresponds to a detected particle. Columns:
1. `x` — x-coordinate
2. `y` — y-coordinate
3. `z` — height
4. `ccr` — cross-correlation value
5. `Frame` — frame number
6. `id` — unique particle ID
7. `Track id` — tracking ID (for tracked particles)
8. `Angle` — orientation angle
---
#### LAFM Localizations (`LAFMLocs`)
- `Data.LAFMLocs`
→ A struct containing LAFM localization results.
- `Data.LAFMLocs.Locs`
→ A table where each row corresponds to a localization event. Columns:
1. `x` — x-coordinate
2. `y` — y-coordinate
3. `z` — height
4. `Peak Prominence` — peak prominence
5. `Particle` — particle ID
6. `Frame` — frame number
7. `Time` — time point
8. `ccr` — cross-correlation value
9. `PT Cloud RMSE` — point cloud root-mean-square error
10. `Error` — localization error estimate